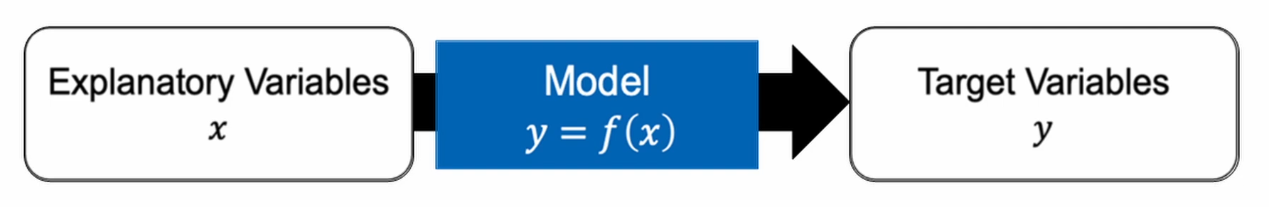
The main goal of Supervised Learning is to understand the relationship between input data, called Explanatory Variables, and an output, called Target Variables, and then create a model to replicate that behaviour.
Mathematically this means , being the output, the input and the model.
Types of Supervised Learning Problems
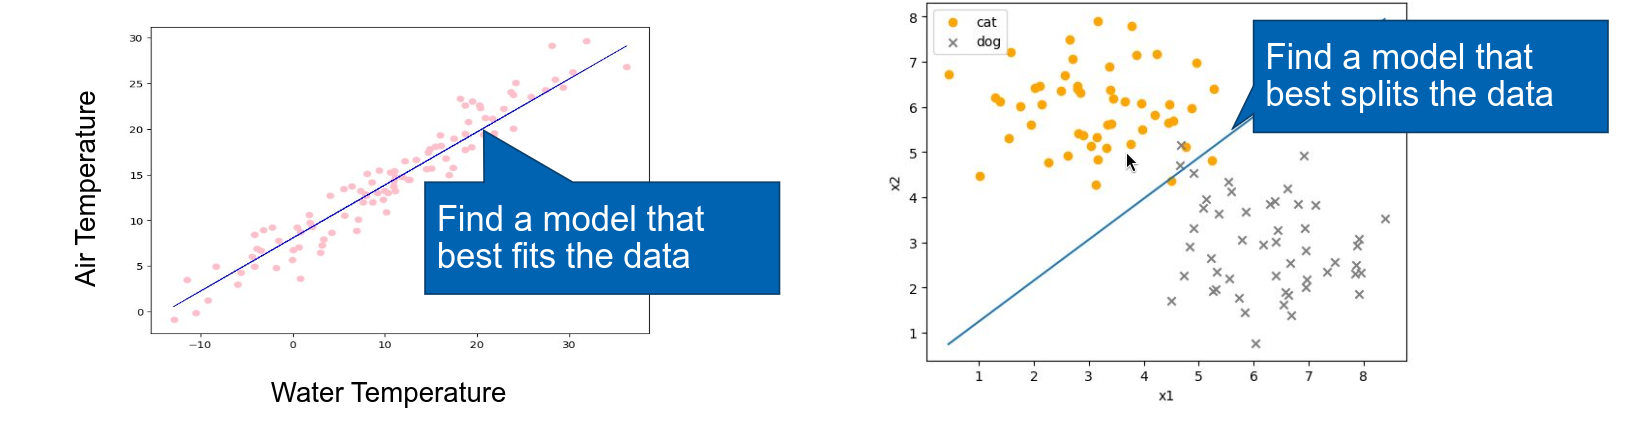
There are two types of supervised learning problems: regression and classification.
Regression
The goal of a regression model is to predict continuous values, any number between a set range, like air temperatures from water temperature.
Classification
The goal of a classification model is to predict discrete values (labels) and separate data into distinct categories.
Goal of Supervised Learning
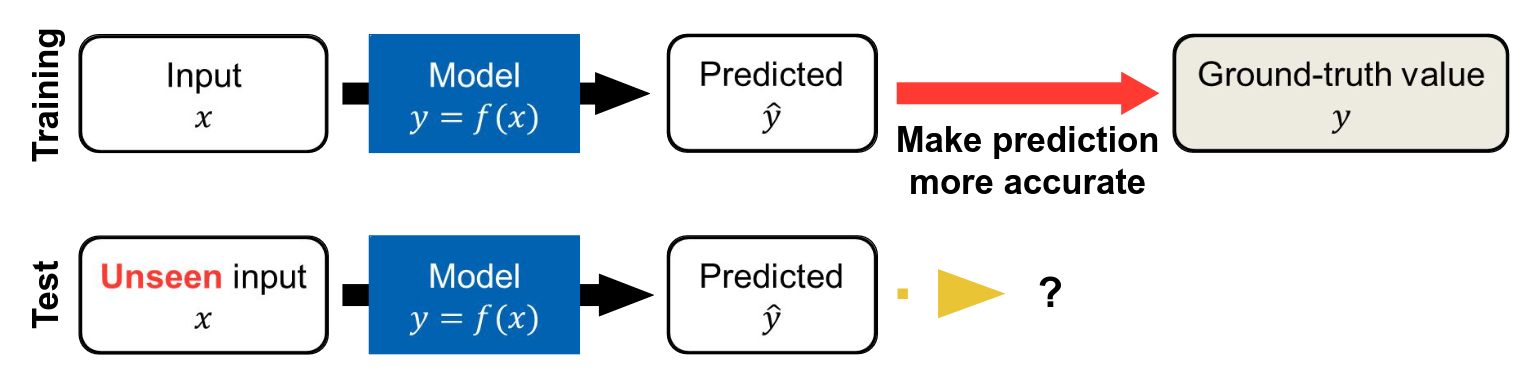
The objective of SL is to find a model that accurately predicts on new, unseen data. It trains using know examples, where the correct is known, to calibrate it’s prediction function, so when faced with real unseen data, it’s able to predict correctly.
 Before moving to a production environment, we need to test the model and rate it’s
precision.
Before moving to a production environment, we need to test the model and rate it’s
precision.
If a model can accurately predict on an unseen dataset, we say that it has successfully generalized the trends and patterns in the data.
Algorithms
Linear Regression
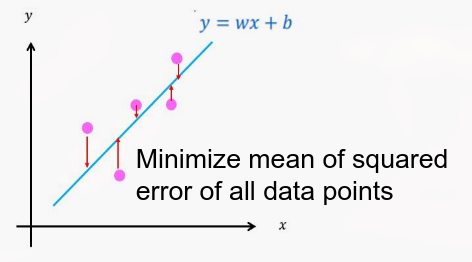
Assume a linear relationship between input/output and find the best fitting line.
Mathematical Definition
Linear regression aims to find the best fitting line or plane described by the equation.
Model:
- is called weight
- is called bias
The goal is to optimize and that minimize the Squared Error, between the model’s predictions, , and the actual values, : .
Logistic Regression
Linear regression model extended for classification problem.
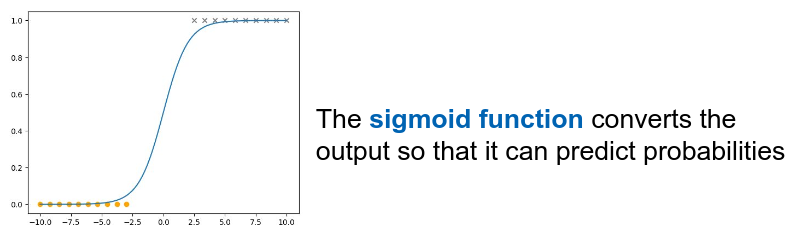 It uses the Sigmoid Function to transform the linear model output into a probability, giving a value of 0 and 1.
To train this model, we find the optimal values of weights and bias by minimizing the Cross-entropy Loss, that measures how close the obtained probabilities are to the true ones.
Decision Trees
Tree-based algorithm that can be used for both regression and classification. It makes predictions by splitting data step by step through decisions.
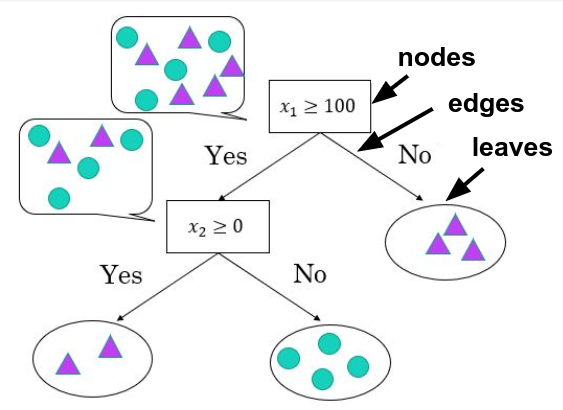 Each node represents a decision point, and each edge represents the path the data takes based on the answer to that question. Eventually the data reaches a leaf, which determines the final decision.
The decision tree calculates chooses its decisions by calculating the information gain, the different in the degree of mixing of the data before and after splitting.
Multiple Linear Regression
In simple linear regression, there was only one explanatory variable for the target variable. Multiple regression extends this concept to cases where there are multiple explanatory variables. Through multiple regression, the coefficients of each explanatory variable (regression coefficients) can be estimated, allowing for the calculation of predicted values. The regression coefficients are estimated in such a way that the squared error between the predicted values and the target variable is minimized.